
GRACC Transition Visualization
The OSG is in the progress of transitioning from an older ElasticSearch (ES) cluster to a new version. Part of this process is reindexing (copying) data from the old to the new. Unfortunately, it’s not easy to capture a status of this transition. For this, I have created the GRACC Transition page.
The goal is to transition when both the old and new ES have the same data. A simple measure of this is if they share the same number of documents in all of the indexes.
Source for this app is available on github: GRACC Transition
Data Collection
Data collection is performed by a probe on each the new and old ElasticSearch clusters. Upload is performed with a POST to the gracc transition website. Authorization is performed with a shared random token between the probe and the website.
The probe is very simple. It queries ES for all indexes, as well as the number of documents and data size inside the index.
There are also many indexes that the OSG is not transitioning to the new ES. In order to ignore these indexes, a set of regular expressions is used to remove the indexes from consideration. Those regular expressions are:
/^osg.*/,           // Start with osg.*
/^ps_.*/,           // Start with ps_*
/^shrink\-ps_.*/,   // Start with shrink-ps_*
/^glidein.*/,       // Start with glidein*
/^\..*/,            // Start with .
/^ps\-itb.*/        // Start with ps-itb*
The Website
The gracc transition app is hosted on the Heroku. I choose Heroku because it provides a simple hosting platform with a database for free.
The website pushes alot of the data processing to the client. The data is stored in the database as JSON and is sent to the client without any transformation. The client pulls the data from the website for both the new and old ES and begins to process the data within javascript.
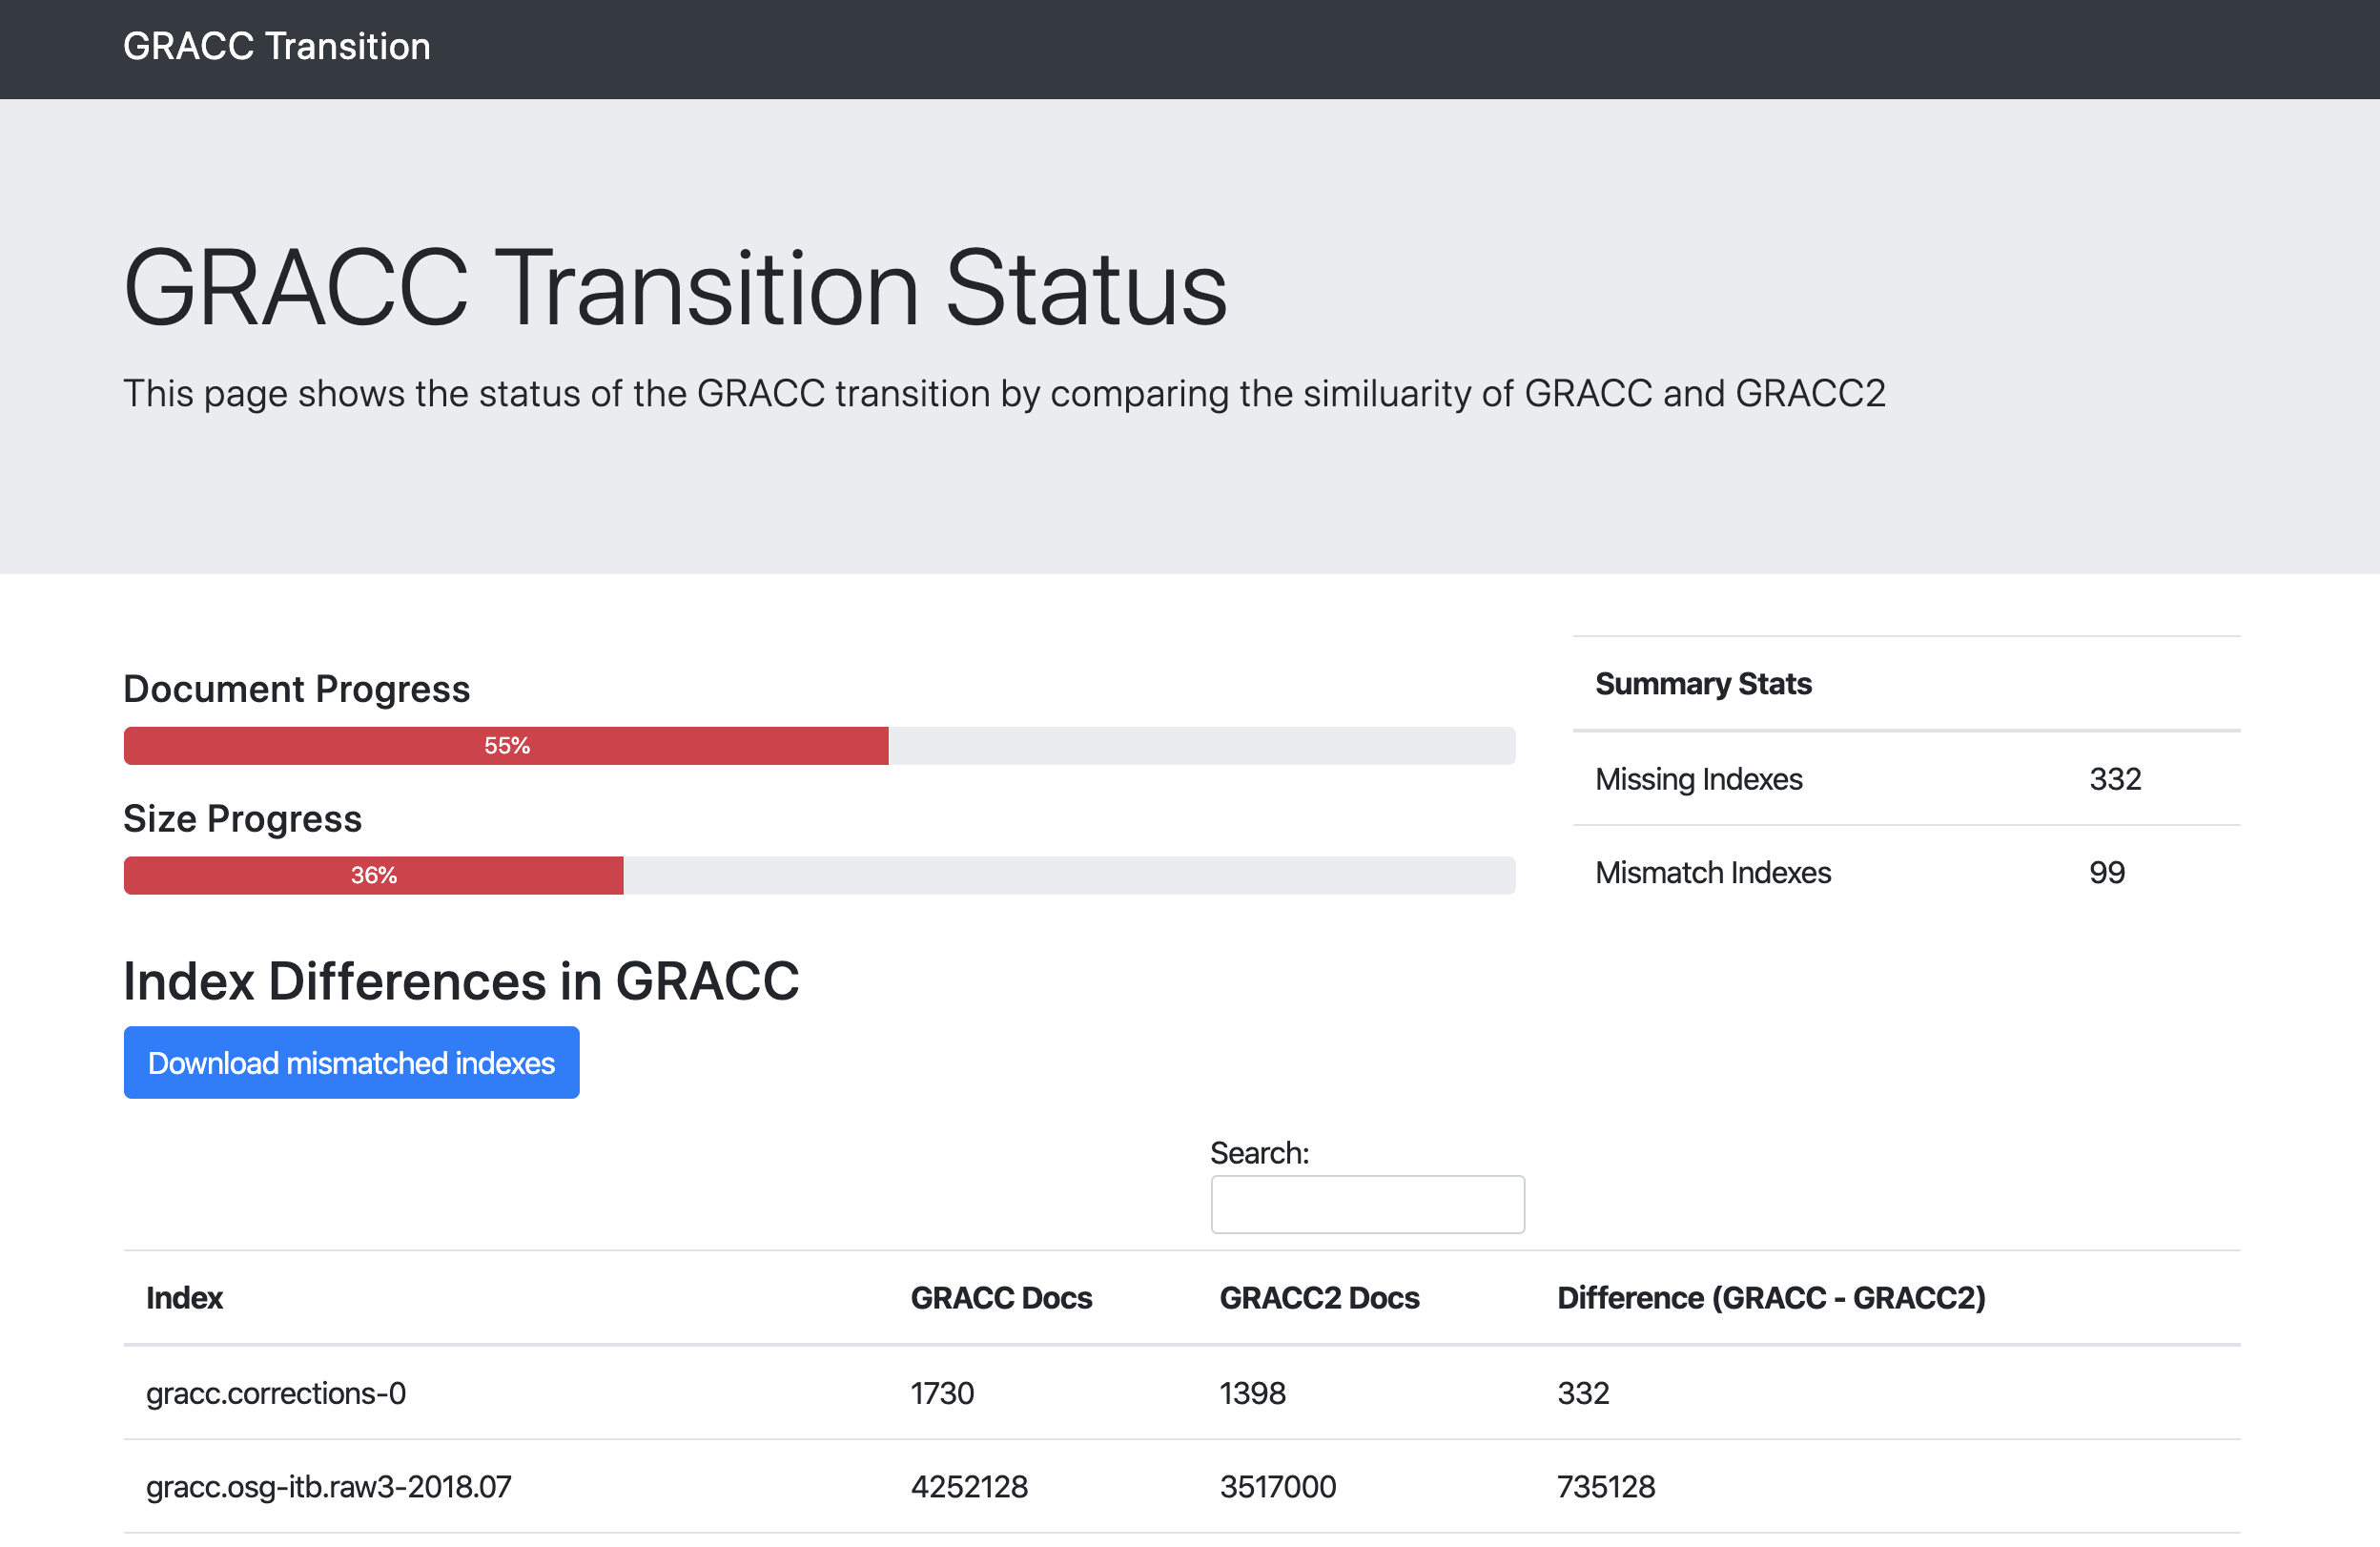
The website breaks the statistics into three visualizations:
- Progress Bars: Comparing the total documents and total data size of the old and new. The progress is defined as new / old. The bars provide a very good visualization of the progress of the transition as they need to reach 100% before we are able to fully transition.
- Summary Statistics: The summary statistics show the raw number of either missing or mismatched indexes. If an index is in the old ES but is not in the new ES, it is counted as missing. If the index is a different size in the old vs. the new, it is counted as mismatched.
- Table of Indices: Finally, a table of indices is shown with the number of documents that are missing, or simply Missing if the index is missing in the new ES.
In addition to the table, I also provide a button to download the list of indexes that are missing or mismatched. This can be useful for an administrator to make sure it matches what they expect or to process with elasticsearch.
Improvements and Future
In the future, I would like to generate a weekly or even daily email to show the progress of the transition. This would give provide a constant reminder of the state of the transition.