
Visualizing Spectrum LSF data with Grafana
Overview
System monitoring is a fundamental part of IT best practices. High performance computing (HPC) environments are no exception to this. At the high-end, HPC clusters can consist of thousands of servers, processing millions of jobs per day. HPC admins need ways to monitor the overall cluster to determine system status and availability through to the efficiency of workloads. Servers today produce a wide array of metrics which can be monitored for example to check for various conditions. Additionally, workload schedulers also produce a wealth of data about jobs. Having a single dashboard to show this type of detail can be of great benefit.
IBM Spectrum LSF Suites provide a complete solution for HPC workload management. This includes reporting capabilities out of the box. Spectrum LSF Suite features an integrated web interface for job management and reporting. The reporting capabilities include a number of reports out of the box, with the ability to customize and add new reports. The reporting capability in Spectrum LSF Suite and IBM Spectrum LSF Explorer is underpinned by Elasticsearch, which is used to store, index and query data. With LSF data in Elasticsearch, it’s also possible to configure LSF command-line interface (CLI) tools to query information from Elasticsearch rather than flat files – for greater performance. This is controlled via the LSF_QUERY_ES_FUNCTIONS parameter of Spectrum LSF. More details about the LSF_QUERY_ES_FUNCTIONS can be found in the LSF documentation here.
(1) Here is a look at the indices that are created by LSF in Elasticsearch. Note that the status shows as yellow because I only have a single Elasticsearch node.
# curl -XGET localhost:9200/_cat/indices
yellow open lsf_events-202205             tejh7jsMSwSeQUJzYM7cww 5 1    1137     0 808.1kb 808.1kb
yellow open lsf_jobs_pendingreason-202204 4wi7Ta8uQPSXlFBqPh4kOQ 5 1   90531     0   8.6mb   8.6mb
yellow open lsf_events-202204             tWYvW_w8TVyU1deRFOEoZg 5 1  116957 32691  59.1mb  59.1mb
yellow open lsf_jobs_active-202212        Q0pStQxvTgaeL7R-f02XWA 5 1  210052     0  50.6mb  50.6mb
yellow open lsf_jobs_pendingreason-202206 ENWIwfGrSqCHvi53aUQXJQ 5 1   44991     0   4.5mb   4.5mb
yellow open host_booleanres_latest        RE8thZCgTGeMBGodeMfXEQ 5 1       5     0  23.3kb  23.3kb
yellow open lsf_jobs_pendingreason-202205 yo0iZH_4TvOqq6kQgBluvA 5 1     111     0 181.4kb 181.4kb
yellow open lsf_jobs_pend-202212          9ViIS3nDRFewrqtILEbKTQ 5 1     707     0 446.9kb 446.9kb
yellow open lsf_hostconf_latest           9N1Y8ML4TiyaamCPEDRQog 5 1       2     0  10.6kb  10.6kb
yellow open lsf_events-202209             rtKQ8F4bSleHl8EbAQez8A 5 1    8200   955   4.4mb   4.4mb
yellow open lsf_events-202206             UUKPWfN7SZ-dzVs5NAkjUg 5 1   79503 23452  36.8mb  36.8mb
yellow open lsf_hostmetrics-202209        7FUNFCWPQtuGyx5jTJLb1A 5 1    4701     0   2.2mb   2.2mb
yellow open lsf_hostmetrics-202208        52xef_3hQWK-jVuJqyUpHA 5 1    3823     0   1.9mb   1.9mb
yellow open lsf_hostmetrics-202207        IqZYhU0RQNGIFWSRH-Ym8Q 5 1    6316     0   2.9mb   2.9mb
yellow open lsf_job_acct-202209           h1ZgCSB8RwCBxwIUUzDHEQ 5 1    2050   438   1.9mb   1.9mb
yellow open lsf_jobs_active-202209        iBfnf07CTcS7Gb6TxwomRA 5 1    2658     0     1mb     1mb
yellow open lsf_hostmetrics-202206        0PXSYBOgTA2Qa_zzaafUPg 5 1    4301     0   2.1mb   2.1mb
yellow open model                         xSqB_T_VSByOzYavEcEVyQ 1 1      55     0   257kb   257kb
yellow open lsf_job_acct-202206           C639GnzBSjCEVczfh5u23g 5 1   16719   353   8.9mb   8.9mb
yellow open lsf_jobs_active-202204        8gN_ENkQRTSfnmxrtMcOlA 5 1   33286     0   9.8mb   9.8mb
yellow open lsf_job_acct-202205           LOxmhm_8RxaCuTd7YWYbLw 5 1     274     0 439.4kb 439.4kb
yellow open lsf_jobs_active-202205        61u2RlXgR_SXagmZfrmttQ 5 1    1880     0   1.1mb   1.1mb
yellow open lsf_jobs_pend-202209          eTgqPp9nQOScNiwyUWXmHA 5 1       9     0 106.2kb 106.2kb
yellow open lsf_job_acct-202204           dDDegS6RQSWtWN99eklexg 5 1   28902  2177  17.4mb  17.4mb
yellow open lsf_jobs_active-202206        8ivkjWSNR1Sh_BxWACP0ZA 5 1   16921     0   4.6mb   4.6mb
yellow open lsf_current_status            92KE3V4YSJ-RtRp_kepxYg 5 1  115450     0     9mb     9mb
yellow open lsf_hostmetrics-202210        vbuK2wW3RRmXuY07tDPUNQ 5 1     785     0 942.1kb 942.1kb
yellow open lsf_jobs_pend-202206          OhSwn-b0SiSj8mCW5tcNIA 5 1      22     0 244.6kb 244.6kb
yellow open lsf_jobs_pend-202205          OfBtWklETYK9cRx000aNPw 5 1       1     0  12.7kb  12.7kb
yellow open lsf_events-202212             WUC5KJWmS-2WIN8XCQpSuw 5 1  712399 74728   337mb   337mb
yellow open lsf_jobs_pend-202204          OhUsXqohSciZTPZlTryMyA 5 1      50     0 275.3kb 275.3kb
yellow open resource_attributes_latest    R9bk_WIPTU62dVg3O1LDBA 5 1       5     0  24.4kb  24.4kb
yellow open lsf_jobs_pendingreason-202212 55iwDC5mRI-eRbzQLwWP6Q 5 1 3314828     0 288.7mb 288.7mb
yellow open pa-lite-log                   o8-jaNoGTsSVcjJW5Ufs0w 5 1    1549     0 547.2kb 547.2kb
yellow open lsf_job_acct-202212           4HXvAD02Sxq0tgp2fS2cfQ 5 1  161502     0  73.6mb  73.6mb
yellow open lsf_hostmetrics-202212        Tki6OJ41R363u9Tx02N4zw 5 1    2548     0   1.7mb   1.7mb
yellow open lsf_jobs_pendingreason-202209 D3TOZY2ORiK9PppGVt10Fg 5 1    2511     0 381.4kb 381.4kb
(2) With the LSF data stored in Elasticsearch, the next step is to connect to the Grafana server. Here we point our browser to the Grafana server on the default port: http://lsf_manager:3000 and login to Grafana. This step assumes an account has already been setup on Grafana. Here we are using the default admin account.
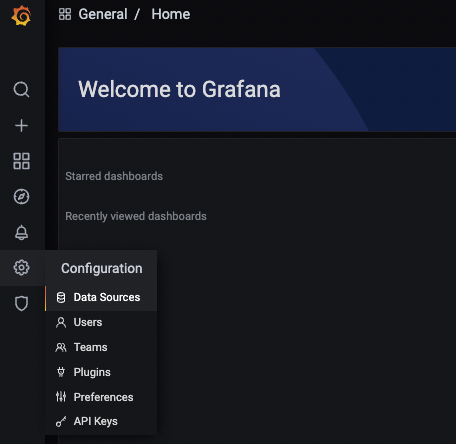
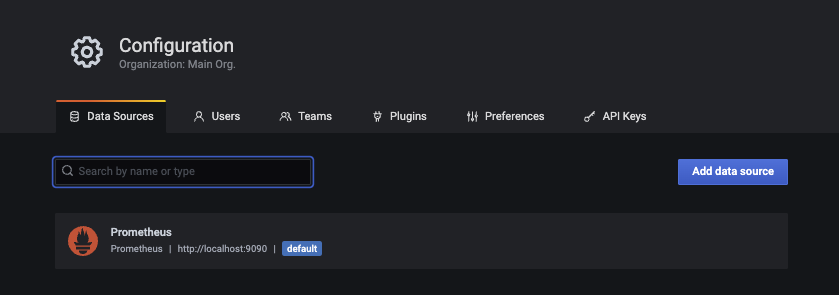
(3) In Grafana, navigate to Configuration -> Data sources. It’s here that it will be possible to add an Elasticsearch data source
(4) Next, click the Add data source button.
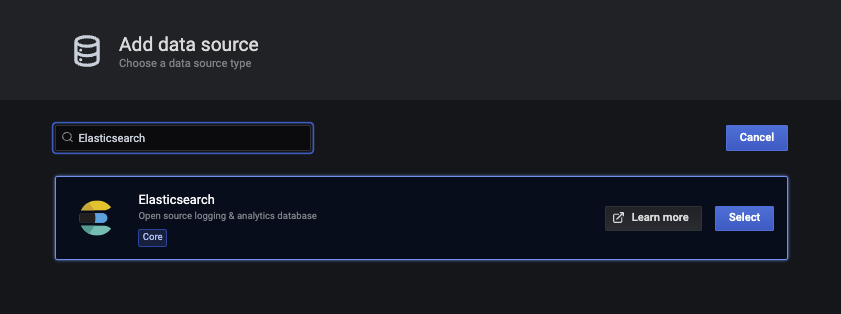
(5 In the list of data sources, filter by name for Elasticsearch and click the Select button on the Elasticsearch entry.
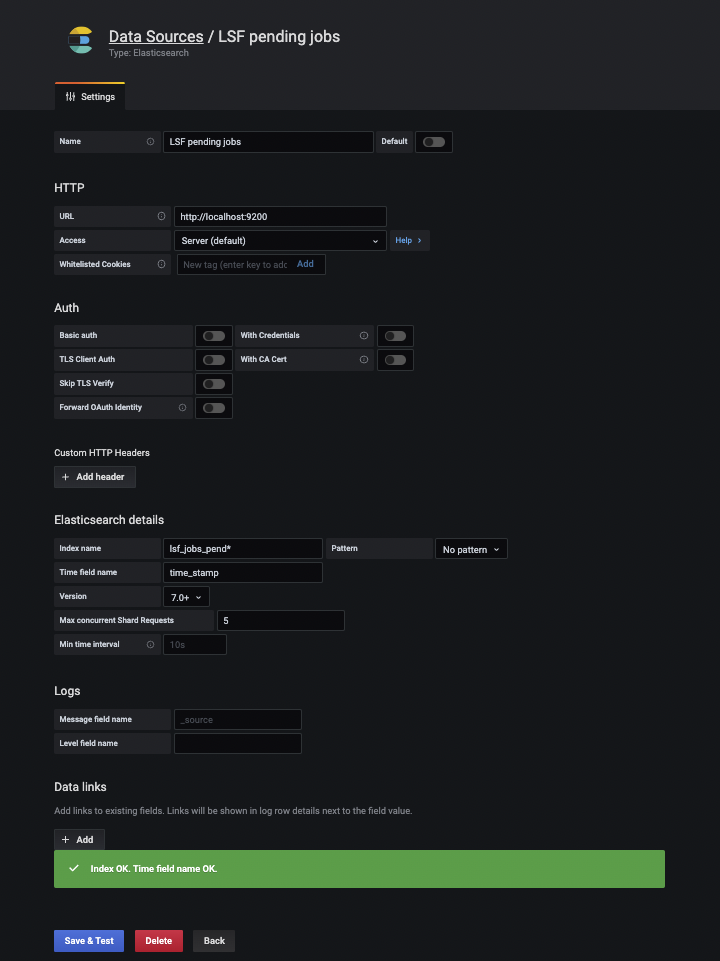
(6) When configuring the data source, it’s necessary to specify an index name. This is where the list of indices in Elasticsearch that we generated earlier will come in handy. For this example, we wish to display the total number of pending jobs in the Spectrum LSF cluster over time. This data is stored in the lsf_jobs_pend* indices in Elasticsearch. To configure the data source appropriately, we specify the following values:
- Name: “LSF pending jobs”
- URL: http://localhost:9200
- Index name: “lsf_jobs_pend*”
- Time field name: “time_stamp”
- Version: 7.0+ Note that the URL needs to point to the Elasticsearch server. In this case, both the Elasticsearch server and Grafana server are running on the same host.
Next click on the Save & Test button. It should return the message Index OK. Time field name OK..
Assuming that no errors were found, click on the Back button.
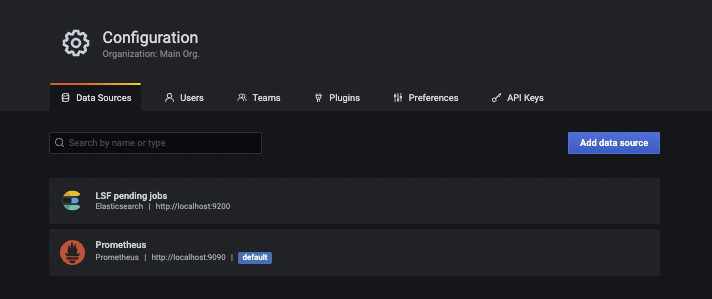
(7) Now you should see LSF pending jobs listed as a Data Source.
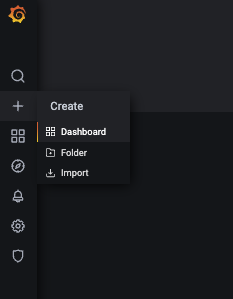
(8) With the data source configured, we’re now ready to configure a dashboard to display the LSF pending job information. Navigate to Create -> Dashboard.
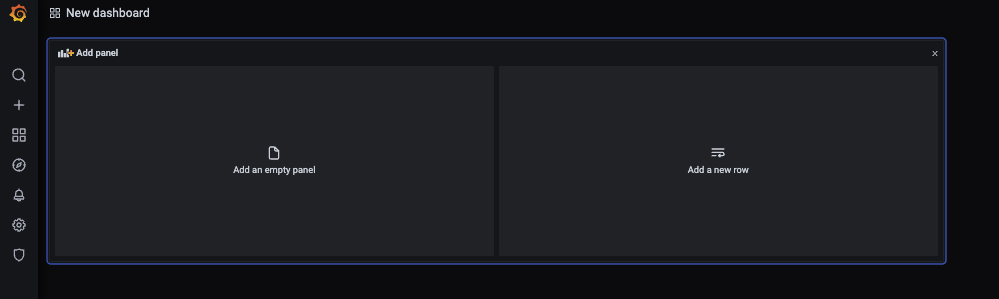
(9) Click on Add an empty panel. This is used to create a new panel where the LSF pending job information will be plotted.
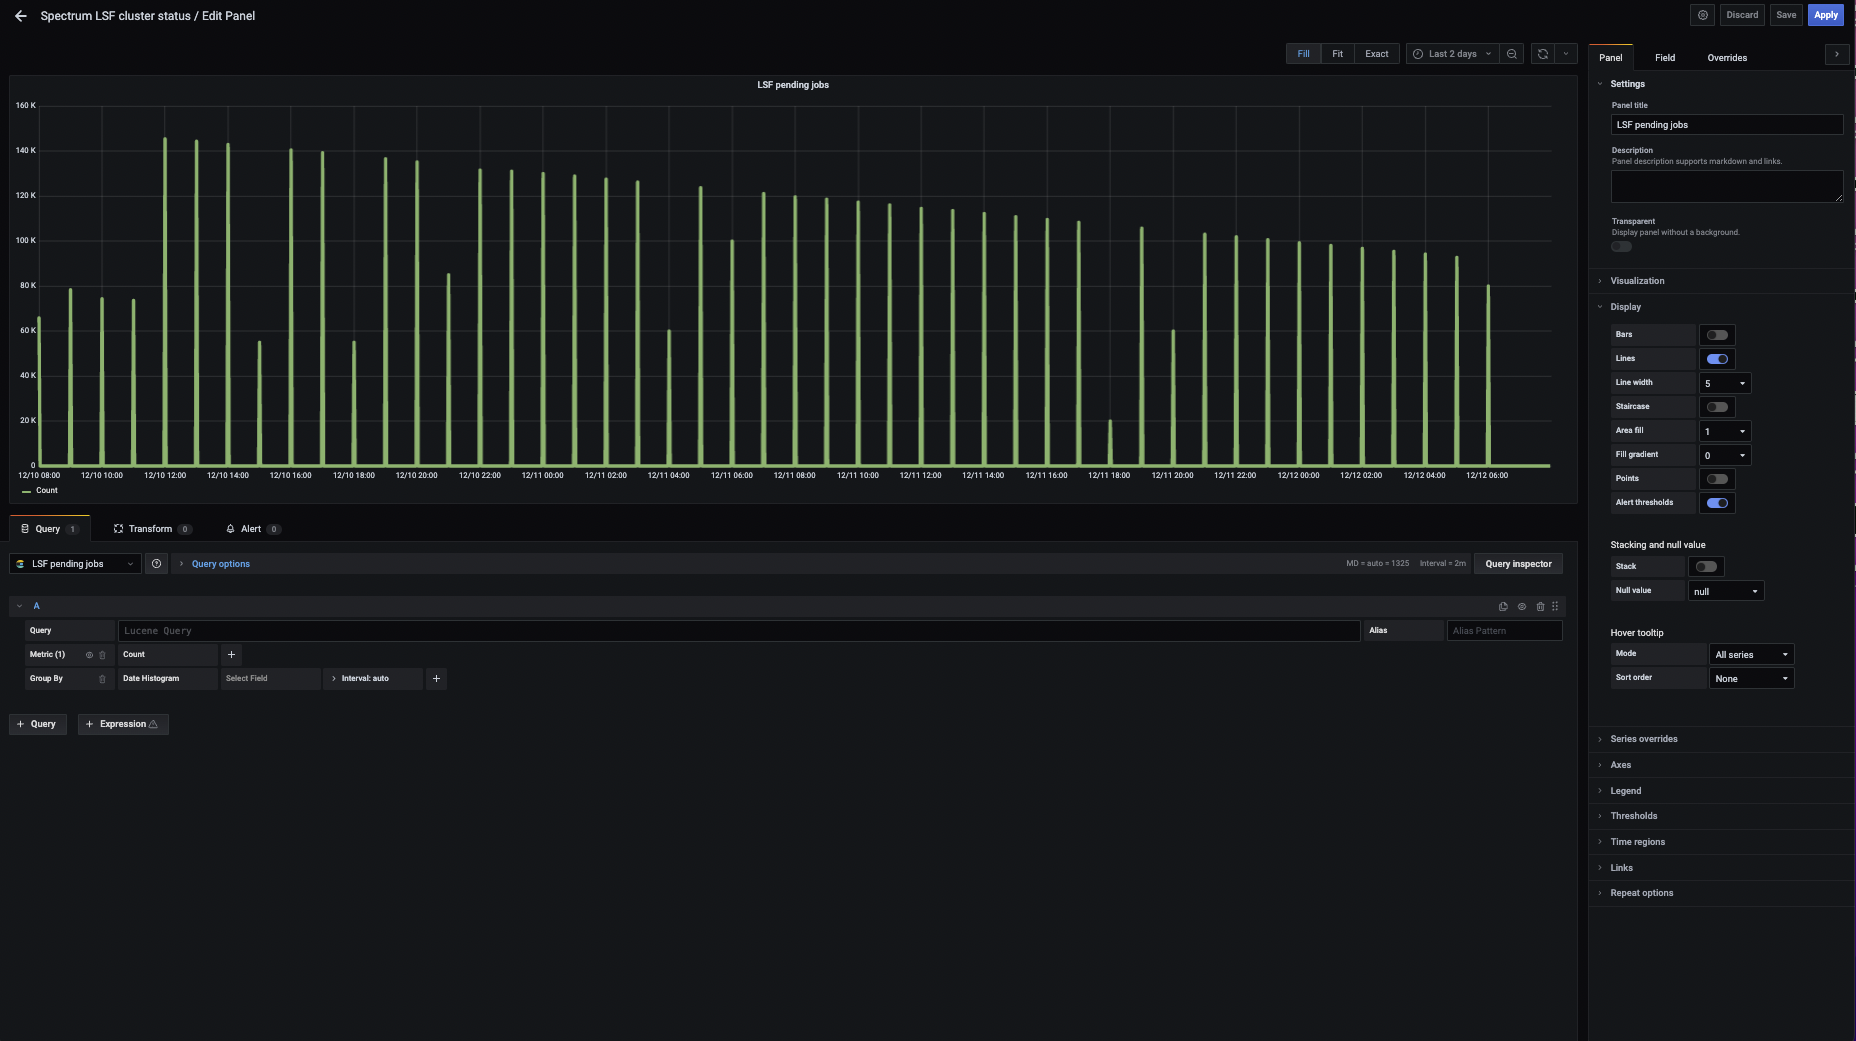
(10) In the panel editor, specify the following options:
- Panel title: “LSF pending jobs”
- Specify the data source “LSF pending jobs” which was created previously
- Specify a suitable time range (2 days)
- Line width (5 points)
You should immediately see in the panel editor the plot of the hourly pending jobs. Click on the Apply button to save the changes.
(11) After clicking Apply, you will be returned to the Dashboard screen. The Dashboard should now display the new LSF pending jobs panel that was created above. This Dashboard could also include panels for system metrics collected by Prometheus for example.
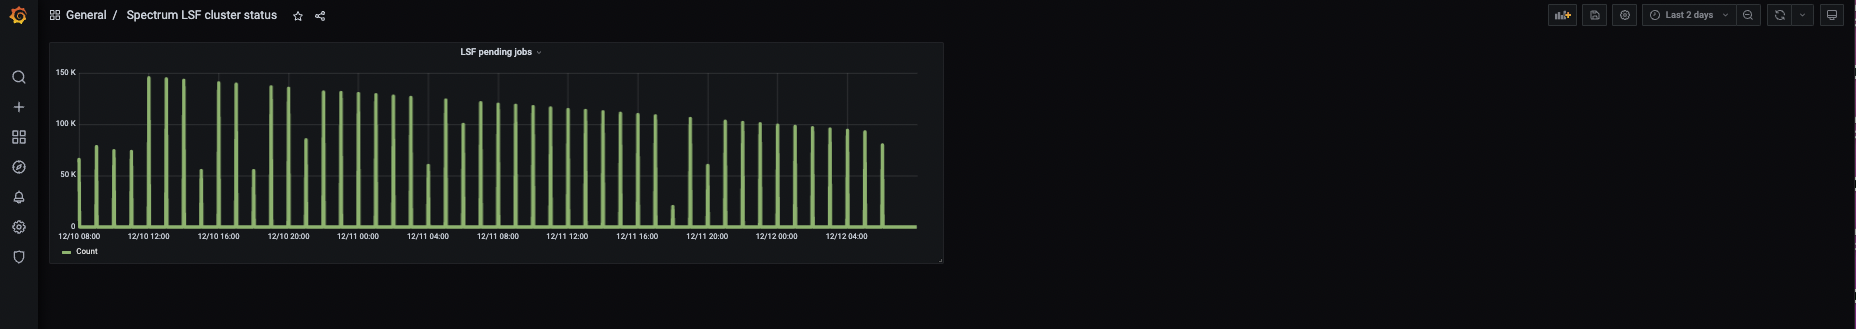
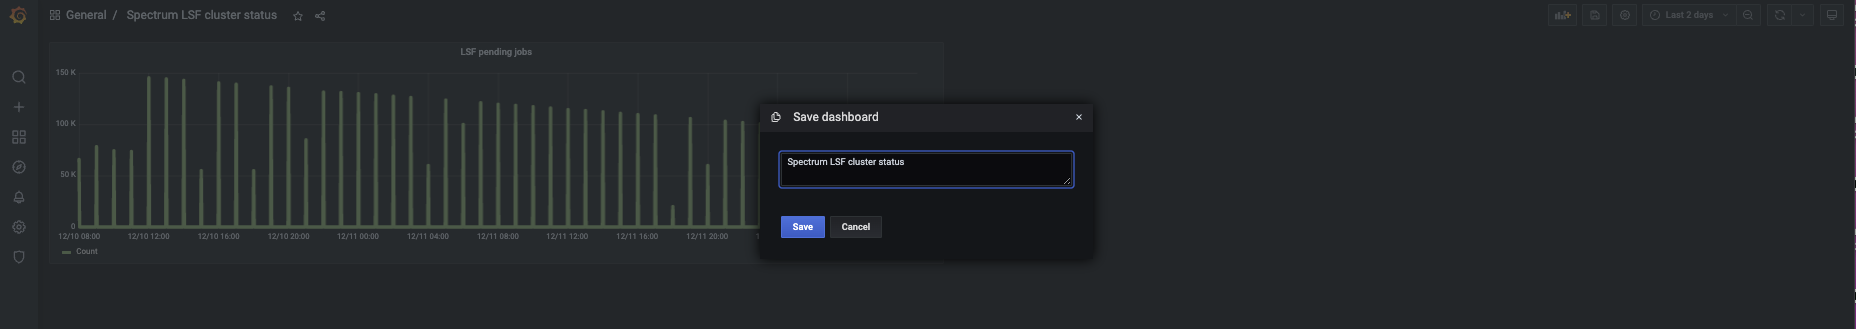
(12) Next, click on the diskette icon in the upper right to save the Dashboard with the LSF pending jobs panel. We’ll name it Spectrum LSF cluster status.
Additional panels can be added to the Spectrum LSF cluster status based on the data logged by Spectrum LSF to Elasticsearch.
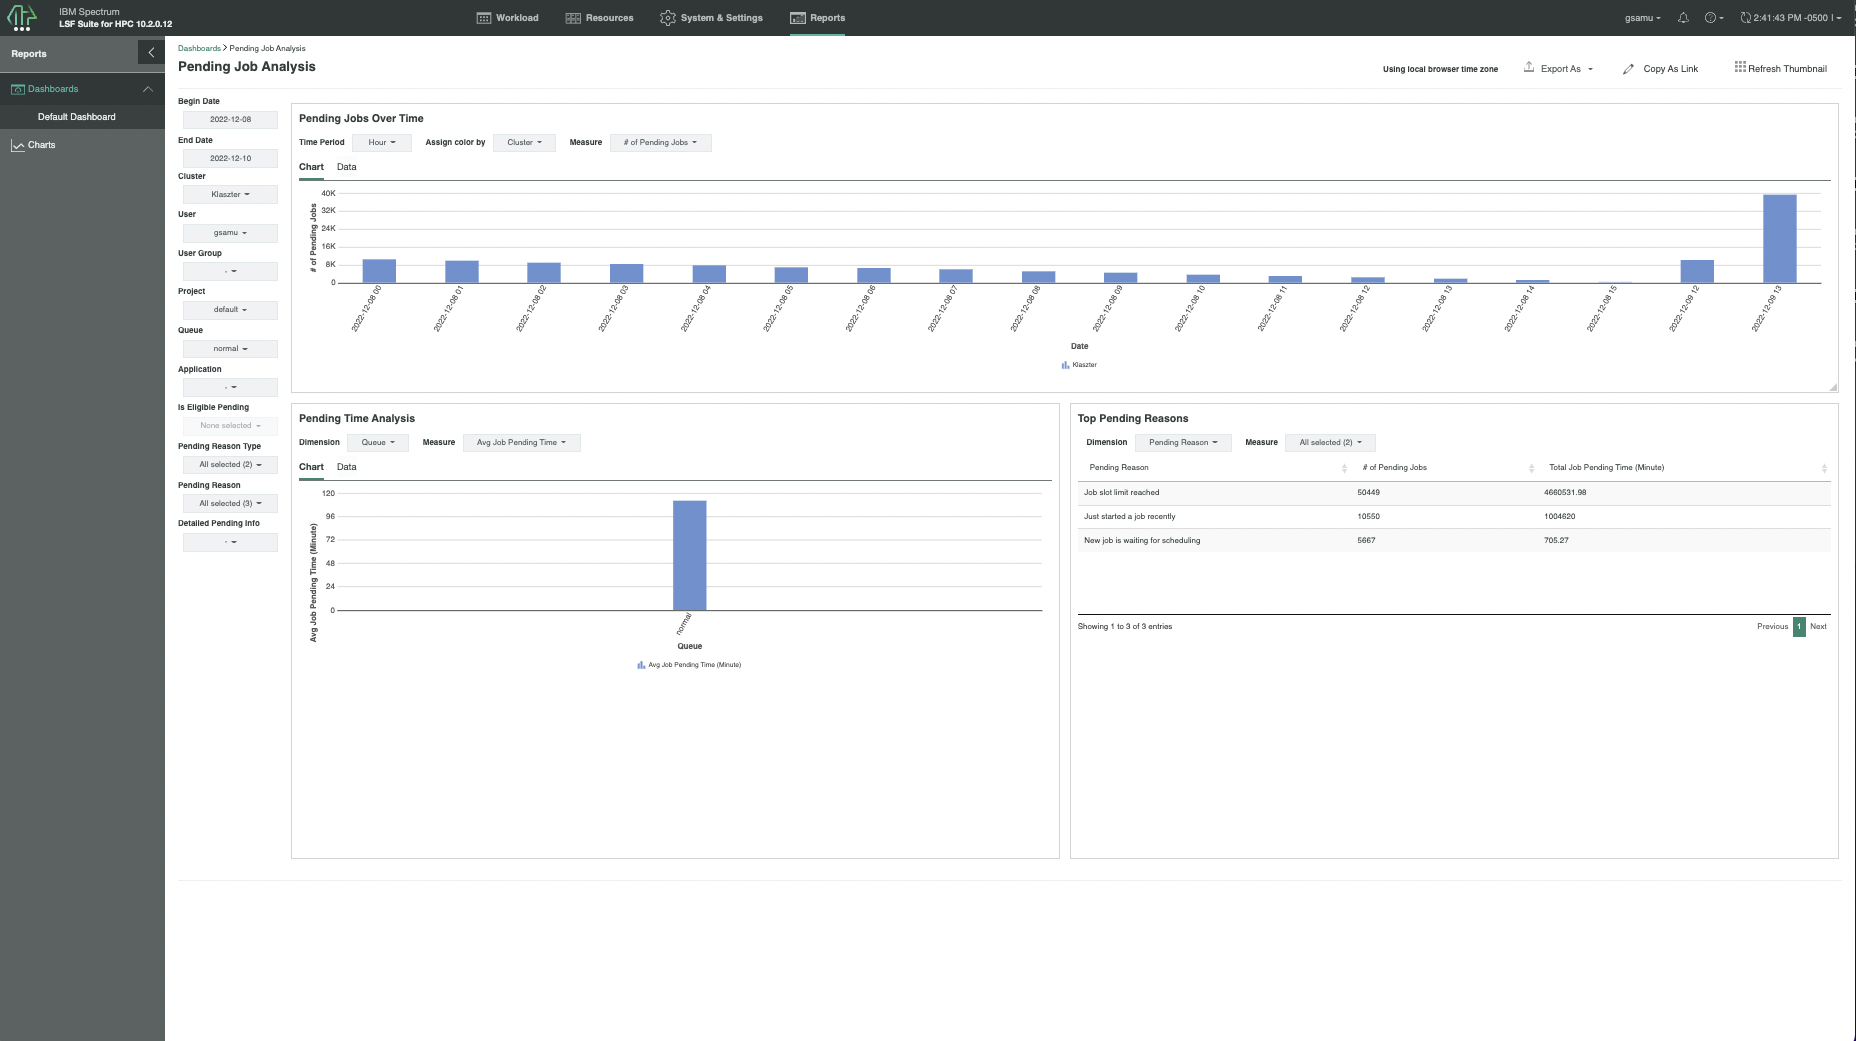
That concludes the simple example of plotting Spectrum LSF cluster data from Elasticsearch in Grafana. As mentioned, the IBM Spectrum LSF Suites integrated web interface also provides reporting capabilities, with several built-in reports provided out of the box. Below, we’ve included a screenshot of the pending job analysis report included with Spectrum LSF Suites.
Summary
Spectrum LSF provides many hooks and integration points enabling administrators to change things ranging from scheduling behavior and the output of query commands through to job information being logged to Elasticsearch. Spectrum LSF is highly customizable by organizations to suit specific needs and requirements. We’ve demonstrated this using Grafana to visualize data from the LSF scheduler in a simple example. Following the above example, administrators can combine existing HPC cluster system level reporting in Grafana with job information from Spectrum LSF for a better overall view and understanding of the infrastructure.